Insights & Reports
Please Verify Your Inputs (Section on Left)
Enter values in the Inputs section (left) to generate your reports and insights. Click "Reset All" to set Defaults.Annual Revenue (ARR)?
Current
$0
+5% GTM Boost
$0
Monthly Revenue (MRR)?
Current
$0
+5% GTM Boost
$0
Net New Monthly Revenue?
Current
$0
+5% GTM Boost
$0
MQL/PQL Sourced Revenue (Annual)?
Current
$0
+5% GTM Boost
$0
MQL/PQL Sourced Revenue (Monthly)?
Current
$0
+5% GTM Boost
$0
MQL/PQL Sourced Revenue %?
Current
0%
+5% GTM Boost
0%
Sales Velocity?
Current
$0
+5% GTM Boost
$0
Lead-to-Revenue Time?
Current
0 days
+5% GTM Boost
0 days
Lead-to-Revenue Conversion?
Current
0%
+5% GTM Boost
0%
Customer LTV?
Current
$0
+5% GTM Boost
$0
CAC Payback Period (TTP)?
Current
0 mo
+5% GTM Boost
0 mo
LTV:CAC Ratio?
Current
—
+5% GTM Boost
—
NOTE: +5% GTM Boost reflects a modest increase across all GTM conversions.
MRR Forecast?Y1: —Y2: —Y3: —
ARR Forecast?Y1: —Y2: —Y3: —
Cumulative Revenue?Y1: —Y2: —Y3: —
Total Customers?Y1: —Y2: —Y3: —
Lead Conversions (Horizontal)?
—
All Leads
—%
→
—d
—
SQLs
—%
→
—d
—
Opportunities
—%
→
—d
—
Closed Won
MQLs
—
Sales SQLs (Direct)
—
Total Leads
—
Lead → SQL Rate
—
Lead → Won Rate
—
Total Cycle Time
—
Lead Conversions (Vertical)?
Stage
Overall
Lead & Pipeline Forecast?Y1: —Y2: —Y3: —
Time To Profit (TTP)?TTP: —Lifetime: —
Service Revenue (% of Total)?Y1: —Y2: —Y3: —
Retention & Expansion %?Y1: —Y2: —Y3: —
NOTE: +5% GTM Boost reflects a modest increase across all GTM conversions.
Leads Pipeline & Conversions?
MQLs
—
×
MQL Conv %
—
Converted SQLs
—
+
Sales SQLs
—
Total SQLs
—
×
SQL → Opp %
—
Total Opps
—
Deal Pipeline Conversions & Revenue?
Total Opps
—
×
Win Rate %
—
Closed Won
—
×
Avg MRR Deal
—
New MRR
—
New ARR (New MRR x 12)
—
Sales Velocity?
Total Opps
—
×
Win Rate %
—
×
Avg Deal Value
—
÷
Sales Cycle (Deal Velocity)
—
Sales Velocity
—
Customer LTV & Insights?
Avg Deal Value
—
×
Gross Margin
—
×
Customer Lifetime
—
LTV
—
LTV
—
÷
CAC
—
LTV:CAC
—
NOTE: All calculations are based on your inputs only.
GTM & RevOps
Inputs & Calculations
Benchmarks & Opportunities
Funnel Impact
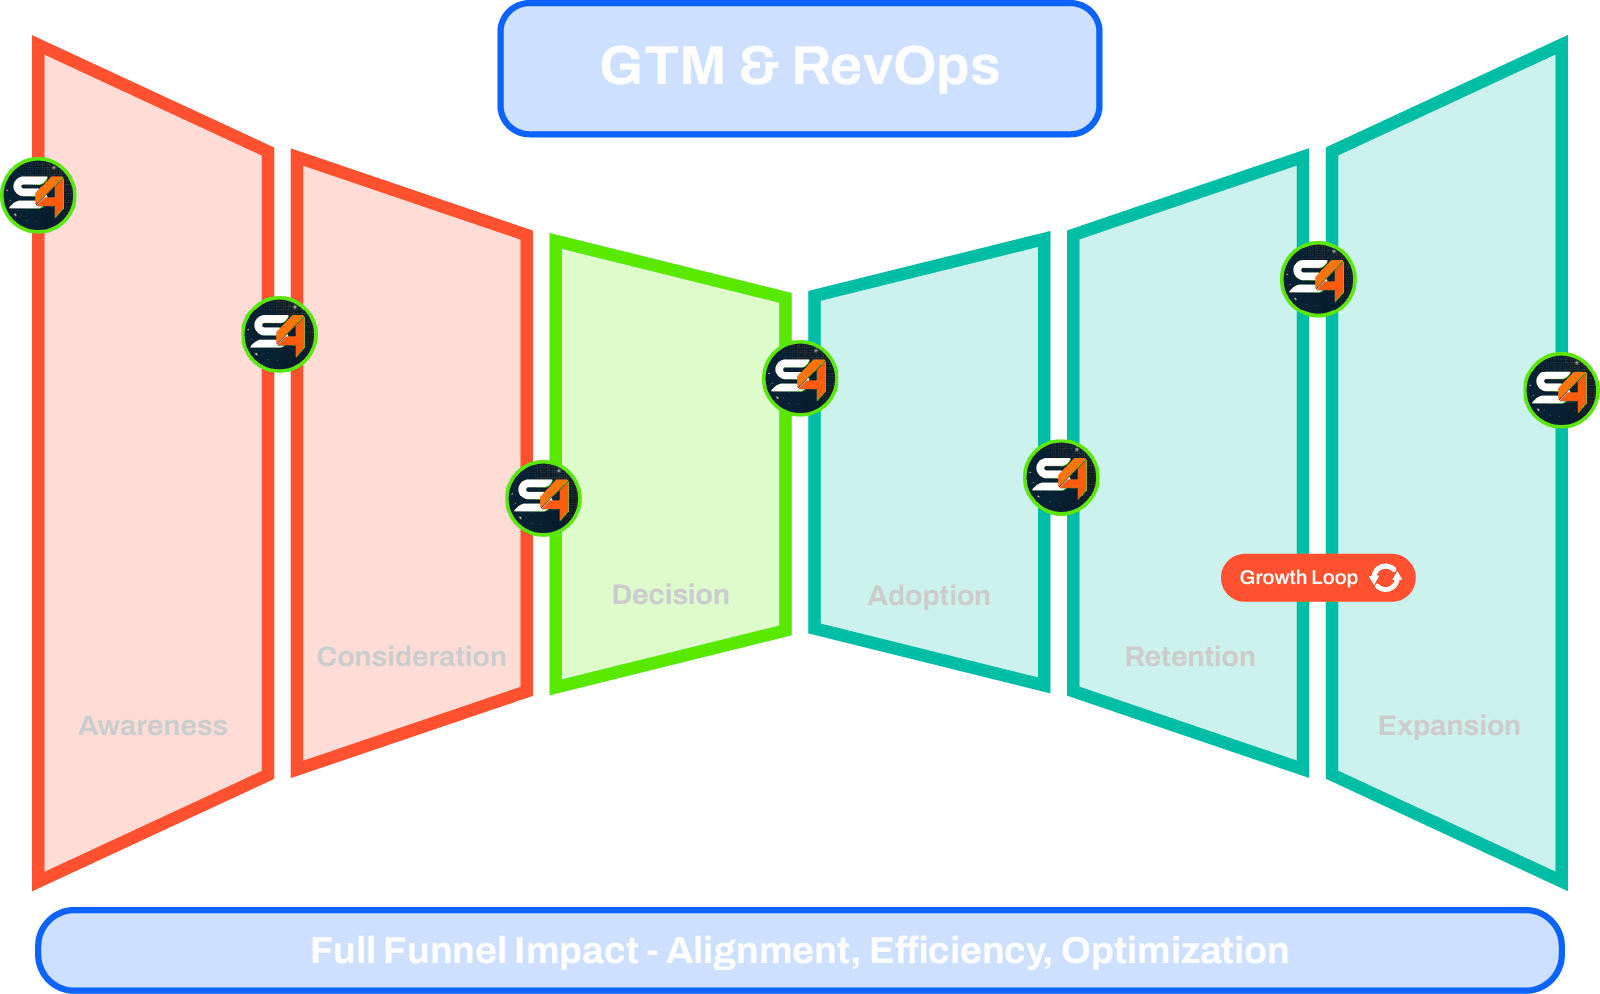 Click to Enlarge
Marketing
Inputs & Calculations
Benchmarks & Opportunities
Funnel Impact
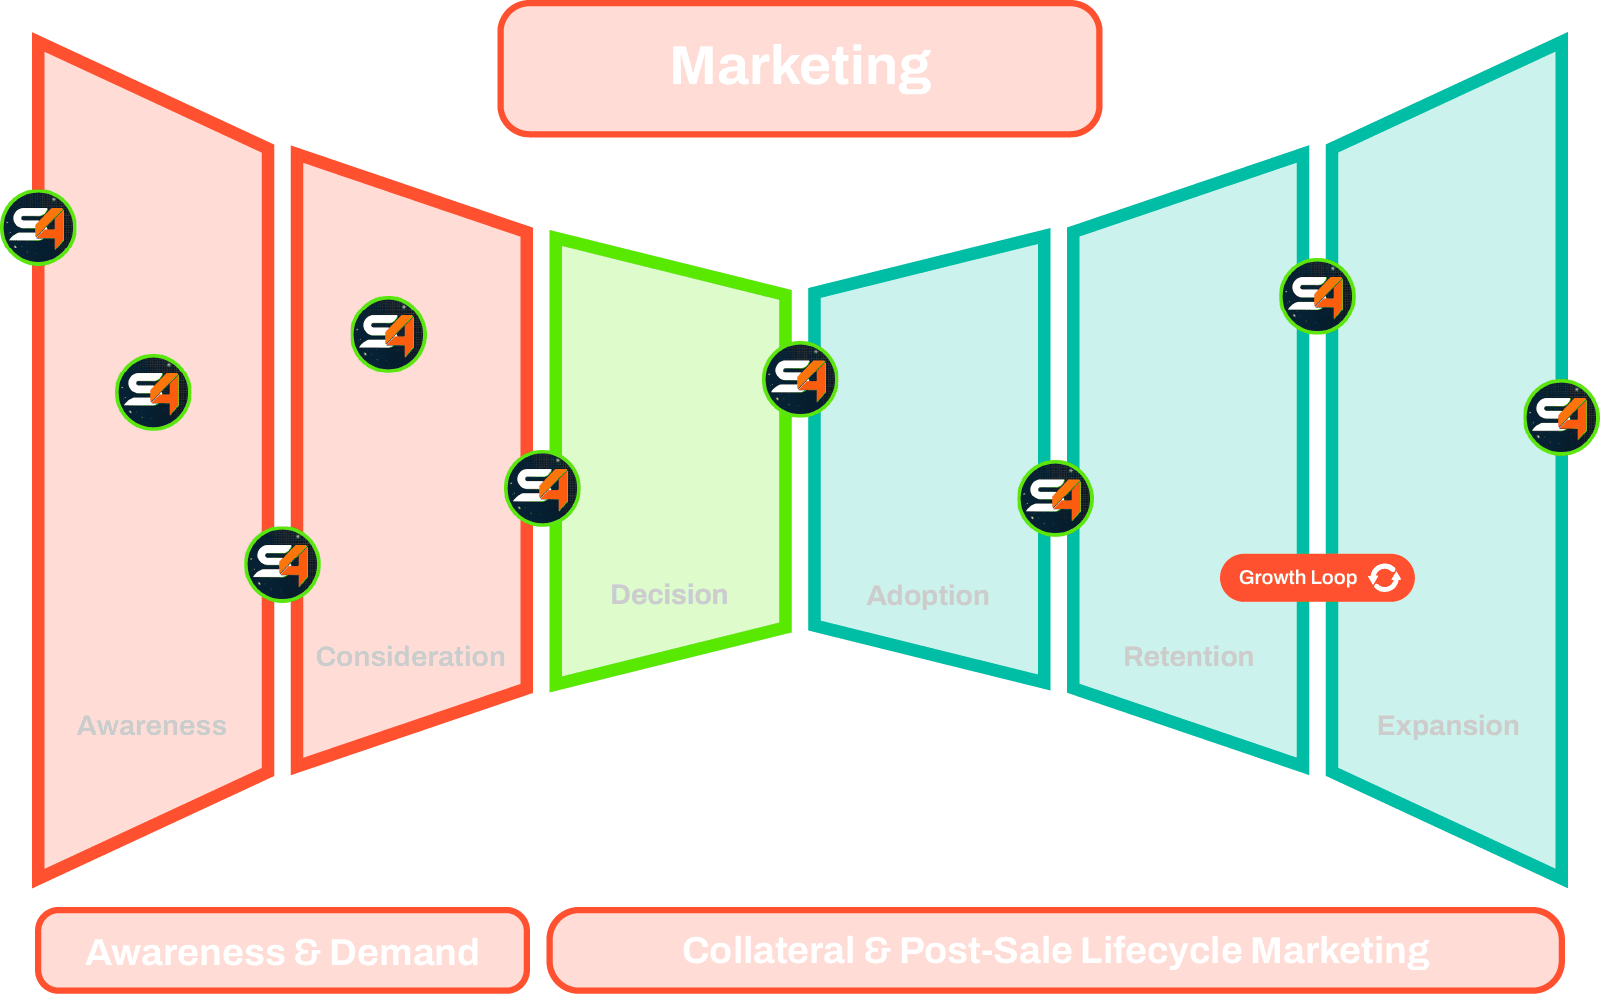 Click to Enlarge
Sales
Inputs & Calculations
Benchmarks & Opportunities
Funnel Impact
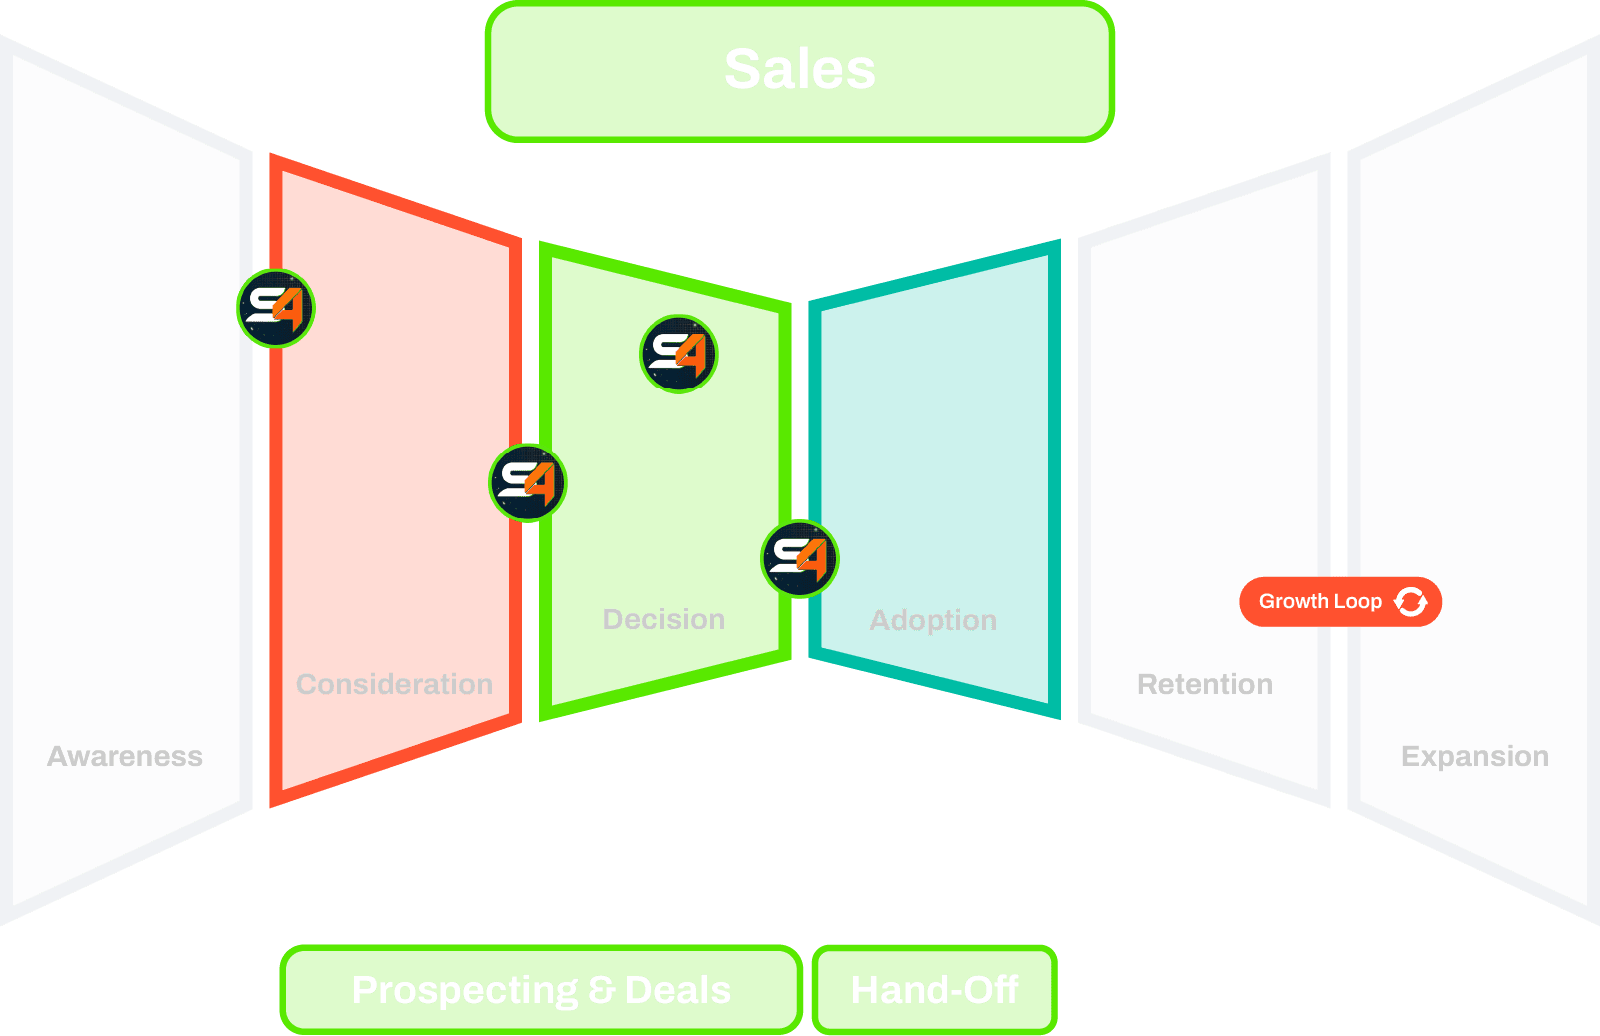 Click to Enlarge
CS & Service
Inputs & Calculations
Benchmarks & Opportunities
Funnel Impact
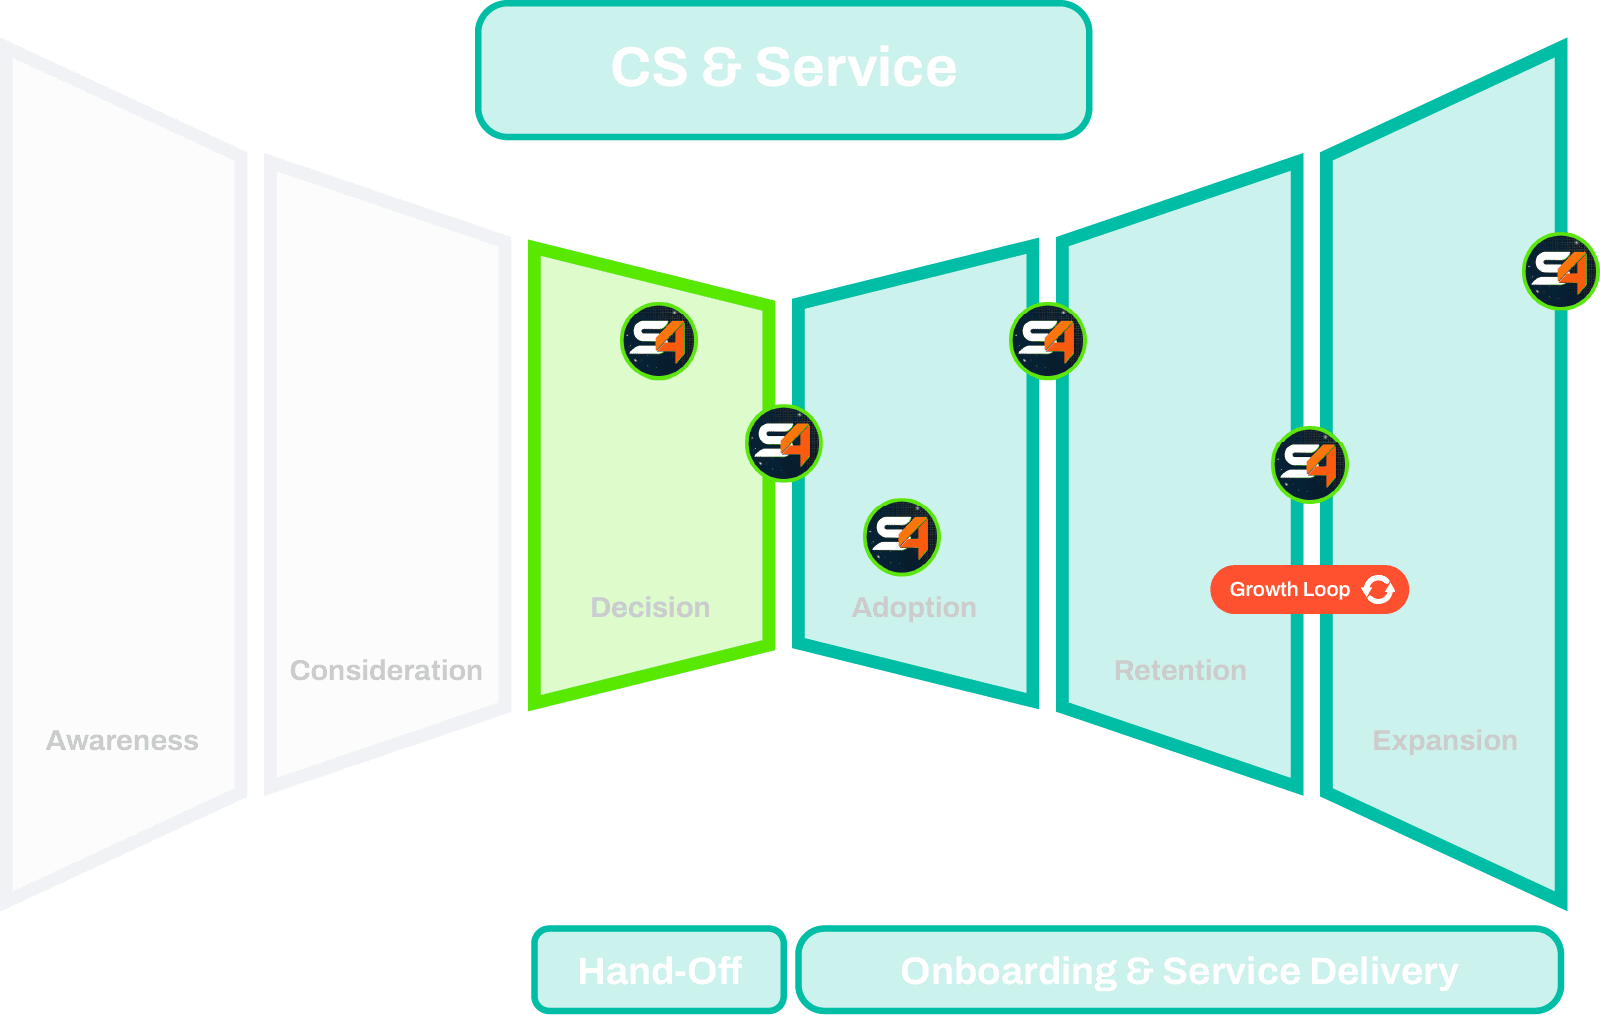 Click to Enlarge
Companies That Invest in GTM/RevOps Typically See:
—
Placeholder Metric
—
Placeholder Metric
—
Placeholder Metric
—
Placeholder Metric
High-Growth B2B Tech / SaaS Companies Typically Spend:
2–6%
Annual Revenue on RevOps
30–50%
Annual Revenue on GTM
What Are You Investing?
Based On Your Investment—You Can Expect:
Current Annual Revenue: —
RevOps Investment: —
Year 1
—
Projected Y1 Revenue Impact
—
Year 2
—
Projected Y2 Revenue Impact
—
Year 3
—
Projected Y3 Revenue Impact
—
At Squad4, we align our pricing for Fractional GTM/RevOps as solely the part of your RevOps budget—augmenting and enabling your GTM Teams to reach new levels of achievement.

Ready 4 Revenue #ExitVelocity?
Let's talk about your next revenue mission and how our fractional team can help make sure you're successful!
That's one simple click for you. One giant leap for your revenue!
That's one simple click for you. One giant leap for your revenue!
We hope you've enjoyed this GTM/RevOps Calculator. If you enjoyed this level of detail and reporting—THIS is what we do for our clients. 🫡 🚀🔥